
All too often, data gets stored in crosstab format in Excel. Whilst crosstabs can be great for presenting data, they’re pretty poor for storing it, as it makes it tricky to manipulate the data. Therefore we often have a requirement to ‘unpivot’, or normalise the data. This is a quick tutorial of one method to unpivot Excel data.
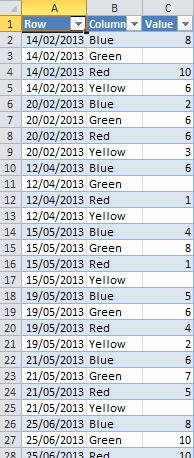
Here’s an example of what we’re working with. This is some meaningless, imaginary data, showing some values grouped in a crosstab by colour columns, and by date rows:
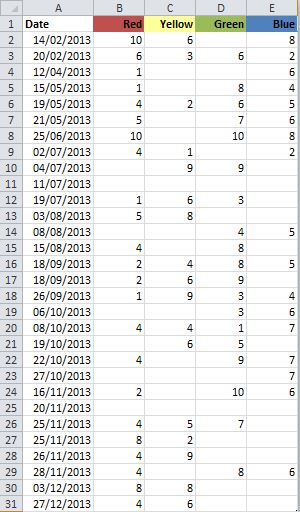
Whilst this seems like a reasonable way to store the information, it actually makes it pretty difficult to answer questions about this data – for example, what percentage of September values were Red?
What we really want is for each row to contain only one value, and for colour to be a column field. Then we can easily use a pivot table to interrogate this data.
We’re going to use a Multiple Consolidation Range pivot table to do the hard work for us.
1. Start off by pressing keys ALT > D > P to open the Pivot Table Wizard dialog box:
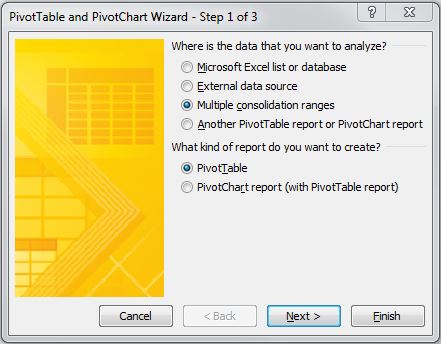
Choose the ‘Multiple consolidation ranges’ option, then click ‘Next’
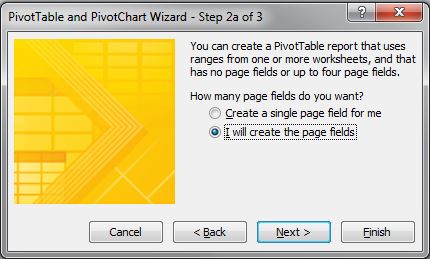
2a. In step 2a of the wizard, choose the ‘I will create the page fields’ option, and click ‘Next’
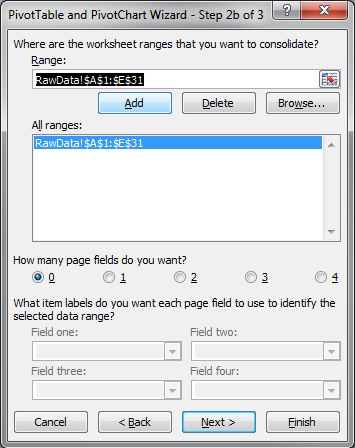
2b. Now we need to add our crosstab data range as a data source for this pivot table. Enter / select the appropriate range, then click ‘Add’. Then click ‘Next’.
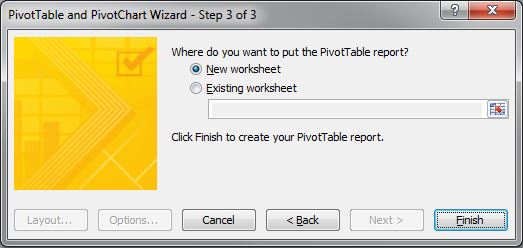
3. Choose a location for the intermediate pivot table (it’s a good idea to use a new worksheet, as we can simply delete the entire worksheet when we’re finished). Then click ‘Finish’.
4. We now have an ‘intermediate’ pivot table, which looks very similar to our raw data, but has some grand totals. Now we want to drill into the source data for this pivot table, by double clicking on the overall Grand Total value – the cell intersection of the Grand Total column, and Grand Total row – circled red:

5. By double clicking to drill into the grand total data source, another worksheet is created, containing a table with our unpivotted data:
You can see that we now have colour as a column field, rather than four separate column headings – which allows us to use this data as a field in a pivot table report.
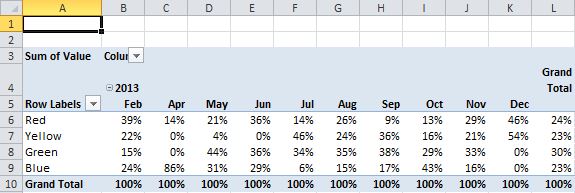
So, returning to our original example question – what percentage of September values were red? – it is now easy to put a quick pivot table together to answer this:
This is one method to unpivot Excel Data, which works well for simple crosstabs. It won’t deal with all cases – for example, where you already have multiple row fields in your data – but for simple cases like this example dataset, it’s a really quick and easy way of making your data a bit more accessible.